Explore dataset
By exploring a dataset, you can get its detailed overview, explore the data of the dataset, view the technical metadata, columns metadata, examine data transformations (calculations and filters applied to the dataset), review the joins between tables, and track the data origin in the lineage graph.
Prerequisites
You have all the necessary role permissions granted by an administrator in Access Manager.
 Permissions
dataprep.access
You have a dataset in the Datasets pane. It can be your own dataset or a dataset shared with you (the View shared content permission).
Procedure
For the dataset that you want to explore, point to  More actions, and click Explore. In
  Tile view, you can just click the tile.
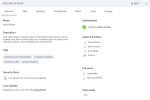
The Explore dataset pane appears with the Overview tab active.
You can modify the dataset by clicking the Edit button in the upper-right corner of the Explore dataset pane at any time.
Navigate through the following tabs to learn more about the dataset.
On this tab, you can view the following information:
- Name — The dataset name. You can edit it if you have the corresponding permissions (the pencil icon appears on the right when you hover over the field).
- Description — The dataset description. You can edit it if you have the corresponding permissions (the pencil icon appears on the right when you hover over the field).
- Tags — Up to 5 tags assigned to this dataset. You can edit the tags if you have the corresponding permissions (the pencil icon appears on the right when you hover over the field).
- Security filters — This section appears only if you have a row-level security filter applied in this dataset. You can review the security filters when opening the dataset in edit mode.
- Last updated — The date and time of the last update to this dataset and the name of the user that performed the update. This data is cached and refreshed hourly. To view the most recent data, refresh it manually by clicking the Refresh icon next to this field.
- Last extract — (Extracts only) The date and time of the last extract.
- Endorsement — This section shows the details of who and when certified this dataset, along with the certification note that you can review when pointing to the certification icon.
- Authors & Editors — The list of users or groups who can edit or manage the dataset.
- Top users — Up to 5 users or groups who visualized the dataset the most. This data is cached and refreshed hourly. To view the most recent data, refresh it manually by clicking the Refresh icon next to this field.
- Total usage — The total number of times the dataset was visualized. This data is cached and refreshed hourly. To view the most recent data, refresh it manually by clicking the Refresh icon next to this field.
You can explore the data of the dataset in a table view, apply pivoting, filtering, and profiling techniques to uncover patterns and characteristics of the dataset. For details, see Explore data in a dataset.
Review the details of all the columns in the dataset:
- Table — The table where the column comes from.
- Column — The name of the column.
- Role — The role of the column: measure, dimension, geo dimension, date, time, and so on.
- Data type — The data type of the column in the original data source.
- Description — The column description. Hover over the description field to view the entire note in the tooltip.
- Views — The total number of times the column was visualized.
Review the calculations created in this dataset:
- Table — The table where the calculation is added.
- Column — The name of the calculated column.
- Formula — The formula of the calculation. Point to the field to view the entire calculation formula.
- Role — The role of the calculated column.
- Data type — The data type of the calculation output.
- Description — The description of the calculation. Point to the description field to view the entire note in the tooltip.
- Views — The total number of times the calculated column was visualized.


Comments
0 comments