Add script calculations
Prerequisites
- You have a respective AI connection to process your scripts. If applicable, you can use a default built-in Python connection. For details, see Add AI connections.
Procedure
You can choose one of the following methods that are suitable for your use case and depending on your role permissions.
Method I — Add a calculation for a dataset
Important: You can add script calculations when you create a dataset. These calculations can be used for all the visualizations that are based on that dataset. However, you can preview the results only for the scalar calculation while in a dataset, and not for the vector calculation.
After you create a new calculation for a dataset that is already used in a widget, ensure you refresh the dataset in the corresponding widget to load new columns.
 Define script calculation
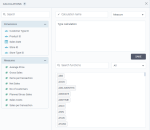
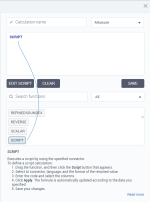
In the Type calculation field, type script or scalar, and then click the Edit script button that appears.
Alternatively, you can drag the SCRIPT or SCALAR function from the list. You can switch between the types at any time before saving the calculation.
 Vector calculation
If using the Vector calculation type, multiple rows are sent as a table to a server for processing in one request. A result will be an array of values–a set of rows for a column. The following is an example of the outlier detection script sending data to a table in Python.
import numpy as np
from sklearn.cluster import DBSCAN
from sklearn.preprocessing import StandardScaler
X = np.column_stack([_arg1, _arg2])
X = StandardScaler().fit_transform(X)
db = DBSCAN(eps=1, min_samples=3).fit(X)
result = db.labels_.tolist()
return result Scalar calculation
With the Scalar calculation type, each row is sent separately and calculated in the server one by one.
Example of a scalar function that converts values in each row to uppercase:
return _arg1.upper()
In the script editor that appears, do the following:
Select the following settings:
- Connector – Python (built-in) or any other defined AI connector.
- Calculation – Specify how to calculate the data in the script by selecting a respective calculation type:
Vector – Multiple rows are sent as a table in one request to the server for processing.
Scalar – Each row is sent and calculated in the server separately, one by one.
- Result – The format of the returned value: double, string, or integer.
Click in the Data frame columns field, and select a column that you want to use as the first argument for the script. Repeat this step for each argument of the script. You can reorder the columns by dragging a column to another place.
If you need to change the aggregation for a column, click a column name, and select a new aggregation type.
For scalar calculations, set the aggregation to None.
In the Script field, enter the code.
Note: You can use only scripts that return data in one column.
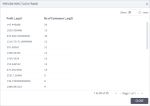
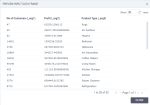
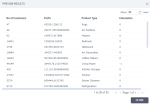
(Only for scalar) Click Preview result to preview the script result in the Calculation column.
The tabular preview is generated.
Click Close.
Click Apply.
The script is added to the calculation pane.
In the Calculation name field, type a name for the calculation.
In the dropdown list next to the calculation name, select the calculation’s data role (such as dimension, measure, and date).
Click Save.
Now, the new calculated column is added to the dataset.
Method II — Add a calculation for a visualization
Important: You can also add script calculations when you work with visualization. These calculations are available for the widget where they were defined. To reuse such calculations, duplicate the widget and the calculations will be available for selection.
 Navigate to the calculations editor
Ensure that the storyboard with the visualization is in edit mode. For details, see Storyboard view modes.
Point to the upper-right corner of the widget where you want to add the calculation.
The widget toolbar appears.

Point to
 Edit, and then click Edit settings.
The widget settings pane appears.
- On the
 data tab, expand the Data section.
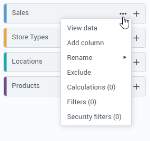
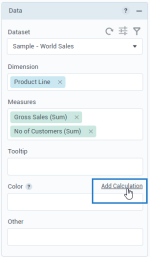
 Point to the data field for which you want to create a script calculation, and then click Add calculation.
The Calculations pane appears.
 Define script calculation
In the Type calculation field, type script or scalar, and then click the Edit script button that appears.
Alternatively, you can drag the SCRIPT or SCALAR function from the list. You can switch between the types at any time before saving the calculation.
 Vector calculation
If using the Vector calculation type, multiple rows are sent as a table to a server for processing, in one request. A result will be an array of values–a set of rows for a column. The following is an example of the outlier detection script sending data to a table in Python.
import numpy as np
from sklearn.cluster import DBSCAN
from sklearn.preprocessing import StandardScaler
X = np.column_stack([_arg1, _arg2])
X = StandardScaler().fit_transform(X)
db = DBSCAN(eps=1, min_samples=3).fit(X)
result = db.labels_.tolist()
return result Scalar calculation
With the Scalar calculation type, each row is sent separately and calculated in the server one by one.
Example of a scalar function that converts values in each row to uppercase:
return _arg1.upper()
In the script editor that appears, do the following:
Select the following settings:
- Connector – Python (built-in) or any other defined AI connector.
- Calculation – Specify how to calculate the data in the script by selecting a respective calculation type:
Vector – Multiple rows are sent as a table in one request to the server for processing.
Scalar – Each row is sent and calculated in the server separately, one by one.
- Result – The format of the returned value: double, string, or integer.
Click in the Data frame columns field, and select a column that you want to use as the first argument for the script. Repeat this step for each argument of the script.
If you need to change the aggregation for a column, click a column name, and select a new aggregation type. The aggregation is considered for preview only if you add a dimension for grouping the measures. If you have only measures, the data is non-aggregated in preview.
For Scalar calculations, set the aggregation to None.
In the Script field, enter the code.
Note: You can use only scripts that return data in one column.
Click Preview result to preview the script result in the Calculation column.
The tabular preview is generated.
Click Close.
Click Apply.
The script is added to the calculation pane.
In the Calculation name field, type a name for the calculation.
In the drop-down list next to the calculation name, select the calculation’s data role (for example, dimension, measure, or date).
Click Save.
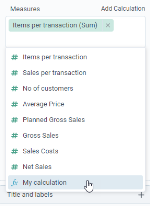
The calculation is added to the data field for which it was created. You can use the new calculation like any other measure or dimension to fill in the visualization data fields.




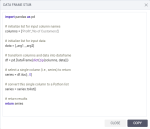
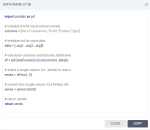
 Generate data frame stub

Comments
0 comments