Annotate visualizations
You can write or draw something on a visualization, then save the visualization together with its annotations. This option is available only for some chart visualizations.
Prerequisites
- The storyboard page containing the visualization that you want to annotate is open in view or edit mode.
- The Trellis data item is not defined in the widget settings pane, on the
 data tab, in the Data section.
Procedure
Point to the upper-right corner of the widget that you want to annotate.
The widget toolbar appears.

Point to
 More options, and then click Annotate.
Point to
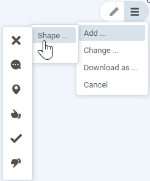
 More options again, and then point to one of the following options:
 Add
AddYou can add shapes or text to the visualizations:
Point to Shape, then select one of the available shapes. By default, the shape is placed in the middle of the visualization. Drag the shape to a new position, resize it, or rotate it as needed.
- Select Text. The text box is placed by default in the center of the visualization. Click in the box, and then type a text. Drag the text box to a new position, resize it, or rotate it as needed.
To save the visualization with its annotations, see the Download as section in this procedure.
 Change
You can customize the appearance of the annotations. Select one of the following options.
Section Use this item to Mode Select the Pencil, Line, or Arrow modes for drawing on the visualization. Color In the list, select one of the colors that will apply to all the drawings, shapes, and texts that you add to the visualization. Size Select one of the sizes in the list that will apply by default to the drawing lines, arrows, and text that you add to the visualization. Opacity Select the opacity (percentage) that will apply to all the drawings, shapes, and texts that you add to the visualization. Undo Undo the last actions. Redo Redo the actions that you undid. To save the visualization with its annotations, see the Download as section in this procedure.
 Download as
You can save a visualization and its annotations to your computer.
After pointing to Download as, select the format in which you want to save the visualization: PNG or JPG.
To delete an annotation object from a visualization, select it, and then click Delete.
Point to
 More options, and click Cancel to close the Annotate option.
Important: If you close the Annotate feature, all your annotations will be deleted. Deletion is performed without confirmation and cannot be undone.

Comments
0 comments