Format dates & numbers
After you add a numeric or date column in a data field, you can change the format specifically for the visualization. If you duplicate or copy a widget, the formats will be preserved.
To format columns for a dataset, see Manage data and data sources in a dataset (Step 2).
Prerequisites
- You added a visualization widget to a storyboard. For details, see Add widgets.
- The widget settings pane is open.
- You selected a dataset and added columns in the respective data fields for the visualization.
Procedure
On the
 data tab, point to a column, click
  Options, and then select Format.
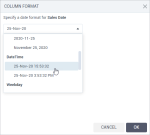
For a date column, set the aggregation to Default, then click
 Options and select Format.
Important: The Default aggregation option for the dates does not aggregate them but only applies a selected format to each record. For example, let’s say you have the three dates: January 1, January 2, and August 1. You select Default and format them as “Year Quarter.” As a result, you get the following three records: 2021 Q1, 2021 Q1, and 2021 Q3.

Note: The column format specified for a column in a visualization takes priority over the dataset format and the default format defined on the
 appearance tab. However, you can quickly return to the original dataset format by clicking
  Reset format.
 Customize the formatting options depending on the column type:
 Format numbers
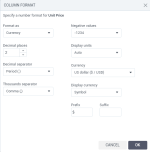
In the Column format dialog, select the format type to apply, customize its options, and click OK.
 Number
You can customize the following format options:
Decimal places
- Select the number of decimal places to display in the number. For example, depending on the decimal places, a number may look like 3.14 or 3.14159.
Decimal separator
- Select the separator to show for decimals: Comma (,), Period (.), Space (), or Custom to provide another separator symbol.
Thousands separator
- Select which separator to show every thousand, for example, 10,000 or 10.000.
- You can select Comma (,), Period (.), Space (), or Custom to provide another separator symbol. To show the number without any separator, select Custom and leave the field empty.
Negative values
- Select how to display negative values: -1234, (1234), or 1234-.
Display units
- Select a specific unit to abbreviate the numbers: None, Auto, Thousands (K), Millions (M), Billions (B), Billions (G), and Trillions (T).
- For example, if the number is 47,000 and the display units are Thousands (K), the number is shown as 47K.
Prefix
- Specify characters that precede each displayed number.
Suffix
- Specify characters that follow each displayed number.
 Currency
You can customize the following format options:
Decimal places
- Select the number of decimal places to display in the number. For example, depending on the decimal places, a number may look like 3.14 or 3.14159.
Decimal separator
- Select the separator to show for decimals: Comma (,), Period (.), Space (), or Custom to provide another separator symbol.
Thousands separator
- Select which separator to show every thousand, for example, 10,000 or 10.000.
- You can select Comma (,), Period (.), Space (), or Custom to provide another separator symbol. To show the number without any separator, select Custom and leave the field empty.
Negative values
- Select how to display negative values: -1234, (1234), or 1234-.
Display units
- Select a specific unit to abbreviate the numbers: None, Auto, Thousands (K), Millions (M), Billions (B), Billions (G), and Trillions (T).
- For example, if the number is 47,000 and the display units are Thousands (K), the number is shown as 47K.
Currency
- Select a currency from the list or specify the custom currency.
Display currency
Select how to display currency: as a symbol ($) or as an international symbol (USD).
Prefix
- Specify characters that precede each displayed number.
Suffix
- Specify characters that follow each displayed number.
 Percentage
You can customize the following format options:
Decimal places
- Select the number of decimal places to display in the number. For example, depending on the decimal places, a number may look like 3.14 or 3.14159.
Multiply by 100
- Select whether to multiply the number representing a percentage. For example, the value of 0.05 will be formatted as 5%.
(Table widget only) You can change the alignment of the values in any column. Under Alignment, select the needed option (left, right, center or auto).


Comments
0 comments