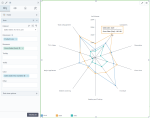
Radar chart
|
|---|
Radar chart |
|
|---|
Polar chart |
A radar chart is used to show the following aspects of the data:
- How one group of variables correlates with another group of variables within a single dataset.
- How data is distributed in relation to the chart's center point.
The radar chart is a line chart drawn on a grid. Each variable is provided an individual axis that starts from the chart's center point. All axes are arranged radially (with equal distances in-between) and share the same scale. The value of each variable is plotted along its individual axis. A point close to the center on any axis indicates a low value, while a point near the axis's edge indicates a high value. All the variables in a dataset are connected to each other to form a polygon.
The polar chart differs from the radar chart by the background grid. The polar chart grid includes circles, which makes it look like a spider's web.
When to use
The radar chart can be used for the following business needs:
- Compare products across several metrics or aspects (for example, price, safety, and durability). In that case, each metric or aspect is assigned a score (for example, 0–10), where higher scores indicate higher values or better performance.
- Display patterns or relationships (for example, how the planned gross sales differ depending on the year or product line).
Data requirements
To build this chart, define the data fields as follows:
- Dimensions – One dimension
- Measures – One or more measures
- Tooltip – (Optional) One or more measures
- Trellis – (Optional) One dimension
- Color – (Optional) One dimension
Use case
The following chart shows the gross sales per product line by year.
The following chart shows the gross sales per product line by store type and year.
References
For details on how to customize your visualization, see Visualization settings.
For a whole list of visualizations, see the following topics:
- Visualizations by function (find a visualization to suit your business case)
- Visualizations by type (find a visualization based on how it is organized on the interface)


Comments
0 comments