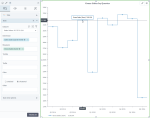
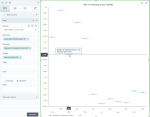
Step line chart
|
|---|
Step line chart |
|
|---|
Step no risers line chart |
A step line chart is a line chart that uses vertical and horizontal lines to connect the two nearest data points in a sequence instead of using the shortest distance to connect them. This results in a step-like progression.
A variant of a step line chart is a step line chart without risers. It uses horizontal segments only; the vertical segments (risers) are hidden.
When to use
Use a step line chart to highlight the irregularity of changes (for example, changes in tax rates or interest rates). Step line charts are especially useful when changes occur at certain times, but the values remain more or less stable between those changes. You can show periods with no change and emphasize the exact time of each change and its magnitude.
Use a step line chart without risers when the risers may attract undue attention.
Data requirements
To build this chart, define the required and optional data fields as follows:
- Dimensions – One dimension
- Measures – One or more measures
- Tooltip – (Optional) One or more measures
- Trellis – (Optional) One dimension
- Color – (Optional) One dimension
Use case
The following step line chart shows the gross sales per quarter.
The following step line chart without risers shows the number of customers per month.
References
For details on how to customize your visualization, see Visualization settings.
For a whole list of visualizations, see the following topics:
- Visualizations by function (find a visualization to suit your business case)
- Visualizations by type (find a visualization based on how it is organized on the interface)


Comments
0 comments