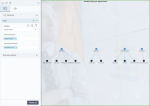
Hierarchy network chart
|
|---|
Hierarchy chart |
A hierarchy network chart shows hierarchical relationships between entities. Entities represent two dimensions and are displayed as round nodes. Each node representing the first dimension is connected with the associated set of nodes representing the second dimension.
When to use
Use a hierarchy network chart to visualize hierarchical relationships between entities (for example, between departments and product lines or between districts and the related schools).
Data requirements
To build this chart, define the required and optional data fields as follows:
- First dimension – One dimension
- Second dimension – One dimension
Important: This widget can visualize up to 100 data rows.
Use case
The following chart shows how product lines are hierarchically distributed across departments.
Tip: The first dimension is always plotted above the second dimension. So, if you want to show a typical hierarchy where the top node is the parent of the lower nodes, you need to add the parent node (for example, a department) as the first dimension; otherwise, the chart will be plotted upside down.
References
For details on how to customize your visualization, see Visualization settings.
For a whole list of visualizations, see the following topics:
- Visualizations by function (find a visualization to suit your business case)
- Visualizations by type (find a visualization based on how it is organized on the interface)


Comments
0 comments