Packed bubbles chart
|
|---|
Packed bubbles chart |
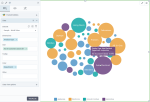
A packed bubbles chart shows all the values of the specified dimension, in the shape of bubbles, where the bubble size represents a specified measure. The bubbles can be colored based on a dimension.
Data requirements
To build this chart, define the required and optional data fields as follows:
- Dimensions – One dimension
- Size – (Optional) One measure (to represent a bubble size)
- Tooltip – (Optional) One or more measures
- Color – (Optional) One dimension
Use case
The following chart shows all the product lines as bubbles, where the bubble size represents the number of customers for the respective product type. The product types are colored by department.
References
For details on how to customize your visualization, see Visualization settings.
For a whole list of visualizations, see the following topics:
- Visualizations by function (find a visualization to suit your business case)
- Visualizations by type (find a visualization based on how it is organized on the interface)


Comments
0 comments