Custom viz
|
|---|
Custom viz |
With the Custom viz widget, you can build a visualization based on your custom JavaScript code. To create a custom visualization, you need to select the data columns that are used to generate the query, and then add the code on how to process and visualize the data.
When to use
Use this widget when you cannot find an alternative visualization in the widgets pane. You need to be familiar with JavaScript and CSS to build your custom visualization.
Data requirements
To build this chart, define the required and optional data fields as follows:
Columns – Dimensions and measures that you want to use in the visualization. The order of the columns is used in the visualization query. In other words, you write the code considering the column’s order (the first column, the second column, and so on).
Other – (Optional) List of columns to be included in the query scope but not used in the visualization layout.
Actions are not supported for the Custom viz as a source. However, you can select the Custom viz as a target for actions except for highlighting.
You can use the Filter widget with the Custom viz. For details, see Filter.
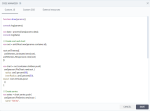
Code Manager
In the Code & resources section, click Code Manager.
On this tab, you add the JavaScript code for your custom visualization.
On the Custom JS tab, before adding the code, review the params object information.
The function draw(params) is called once before the renderer is used and the params object is passed.
Properties in the params object:
container – The DOM div element.
columns – An object that contains column metadata.
data – An array with the dataset metadata.
colors – An array with palette colors in hex format.
formatValue – A built-in format value method.
The console.log(params) loads the params object into the web browser console after you save this tab and visualize the widget.
For example, you can learn how the columns are loaded: ‘c1’ is the first column and ‘c2’ is the second column selected in the Columns field.
On this tab, you can add the links to external JS libraries and CSS files. The external resources are loaded in the order that you add them.
To add a link, click Add new resource, enter the URL and select the resource type (JavaScript or CSS).
To remove a resource, point to the row, and then click Delete.
Use case
The following heatmap shows the magnitude of the earthquakes around the world. The custom visualization is built using Leaflet, an open source JavaScript library.
References
Try building your first custom viz: Build a custom JavaScript viz – Tutorial.
For details on how to customize your visualization, see Visualization settings.
For a whole list of visualizations, see the following topics:
- Visualizations by function (find a visualization to suit your business case)
- Visualizations by type (find a visualization based on how it is organized on the interface)


Comments
0 comments